Running a soap factory at razor-thin margins? You’re not alone. Raw material prices fluctuate, energy bills climb, and labor costs keep rising—squeezing profitability from every direction. The good news: most soap manufacturers leave significant savings on the table through inefficient processes, oversized equipment, or outdated energy systems.
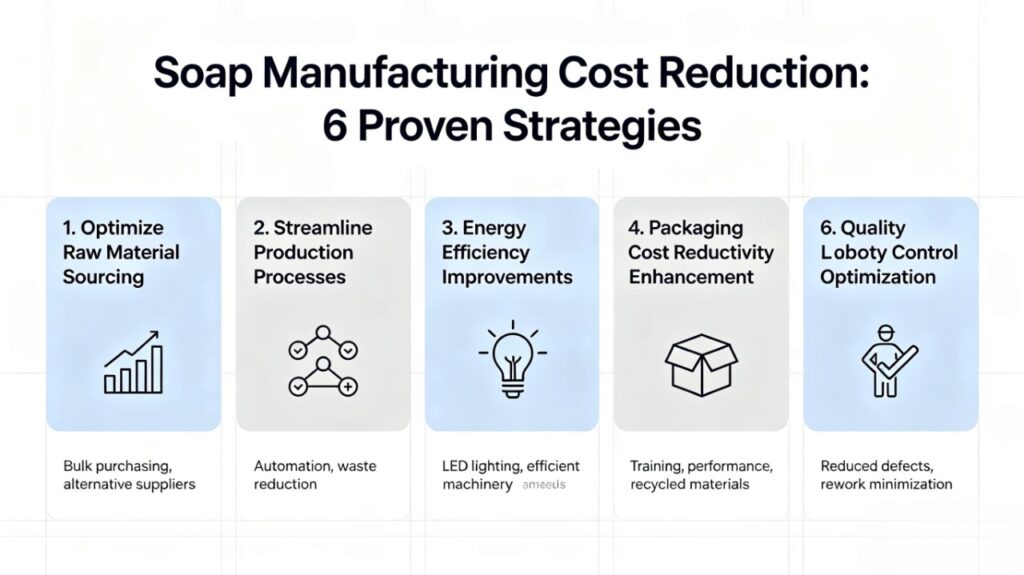
This guide breaks down six actionable strategies that industrial soap producers use to cut costs by 15–30% without sacrificing output quality or throughput. Each section includes equipment specifications, realistic benchmarks, and ROI estimates so you can prioritize your investment.
The strategies span the full production chain—from saponification and soap base processing through to final packaging and wrapping operations—because meaningful cost reduction requires a systemic approach, not piecemeal fixes.
2. Reduce Raw Material Waste Through Precise Dosing
Raw materials—primarily fats, oils, and caustic soda—represent 50–65% of total production cost for most soap manufacturers. Even a 2–3% reduction in overuse delivers meaningful savings at scale.
Common sources of material waste:
- Manual weighing errors in batch recipes (±3–5% is typical without automation)
- Foam and splash losses during mixing
- Excessive superfatting from imprecise NaOH titration
- Soap noodle losses at the plodder throat and die
Dosing and metering solutions:
- Gravimetric dosing systems: Automated load-cell-based dispensing achieves ±0.1–0.3% accuracy versus ±2–5% for manual weighing. ROI is typically 6–12 months at medium-scale plants.
- Inline NaOH concentration monitoring: Real-time conductivity sensors prevent under- or over-saponification, reducing batch rejection rates.
- Closed-loop plodder control: Servo-driven pressure control minimizes soap noodle scrap at startup and shutdown.
Benchmark data:
- Plants switching from manual to automated dosing typically report 2–4% reduction in raw material consumption.
- At a plant producing 10 tons/day with $1,200/ton material cost, a 3% reduction saves approximately $131,000/year.
4. Cut Downtime Costs With Predictive Maintenance
Unplanned downtime in soap manufacturing typically costs $500–$2,500 per hour when accounting for lost throughput, restart waste, and overtime labor. A single unexpected plodder failure can cost more than an entire month of preventive maintenance investment.
Key maintenance cost drivers:
- Plodder barrel and screw wear (replacement every 12,000–20,000 hours depending on formula abrasiveness)
- Cutter blade wear (typically every 300–500 hours)
- Packaging machine film tension drift (causes reject spikes and film waste)
- Pump seal failures in lye handling systems
Predictive maintenance toolkit:
- Vibration sensors on motors and gearboxes: Detect bearing wear 2–6 weeks before failure, allowing planned replacement during scheduled downtime.
- Thermal imaging on electrical panels and heat exchangers: Identify hotspots before they cause failures.
- OEE (Overall Equipment Effectiveness) tracking: Measure availability, performance, and quality rates. Industry average OEE for soap lines is 65–75%; best-in-class plants achieve 85%+.
- Spare parts inventory rationalization: Stocking critical spares (seals, blades, belts) eliminates emergency procurement costs.
Cost comparison:
| Maintenance Approach | Annual Cost (10 t/day plant) | Downtime Hours/Year | Total Cost of Downtime |
|—|—|—|—|
| Reactive (breakdown only) | $18,000–$30,000 | 120–200 hrs | $90,000–$300,000 |
| Preventive (scheduled) | $25,000–$40,000 | 60–100 hrs | $45,000–$150,000 |
| Predictive (sensor-based) | $35,000–$55,000 | 20–40 hrs | $15,000–$60,000 |
The transition from preventive to predictive maintenance typically delivers a net saving of $40,000–$120,000/year at medium-scale plants.
6. Implement Process Data Monitoring for Continuous Improvement
You can’t reduce what you can’t measure. Many soap manufacturers track output volume but have limited visibility into yield rates, energy intensity per ton, or batch-to-batch consistency—the data streams that reveal where cost is actually leaking.
Key performance indicators to monitor:
- Energy intensity: kWh per ton of finished soap (industry benchmark: 180–320 kWh/ton depending on process type)
- Material yield: Finished product weight ÷ total raw material input (target: 97–99%)
- First-pass quality rate: Bars passing weight, dimension, and hardness checks on first inspection (target: 98%+)
- OEE per production line: Availability × Performance × Quality (target: >80%)
- Packaging film waste rate: Film consumed per 1,000 bars wrapped (benchmark: <2% waste at full-auto lines)
Implementation pathway:
1. Install energy sub-metering on major loads (reactors, dryers, compressors)
2. Connect production counters to a simple SCADA or MES dashboard
3. Set weekly KPI review meetings with line supervisors
4. Use trend data to identify and prioritize improvement projects
According to the Statista soap industry overview, global bar soap production volumes continue to grow—particularly in emerging markets—making operational efficiency a key competitive differentiator for equipment-intensive manufacturers.
Process monitoring investment at a mid-scale plant typically runs $15,000–$40,000 for hardware and software, with productivity improvements of 3–8% commonly reported within the first year—delivering a payback of 12–24 months.
Ready to Reduce Your Production Costs?
Cutting soap manufacturing costs isn’t about finding one magic fix—it’s about stacking incremental improvements across the production chain. The strategies outlined above are proven at scale and applicable whether you’re running a 2-ton startup line or a 50-ton industrial operation.
Our engineering team can help you:
- Audit your current production line for cost reduction opportunities
- Specify equipment upgrades with accurate ROI projections
- Design a phased implementation plan that minimizes production disruption
Contact STING Industry today:
- 📧 Email: frank@stingholdings.com
- 🌐 Website: www.sting-industry.com
- 📞 Phone/WhatsApp: +86 13773617404
_Ready to see real numbers for your plant? Request a free cost reduction assessment and we’ll respond within one business day._