
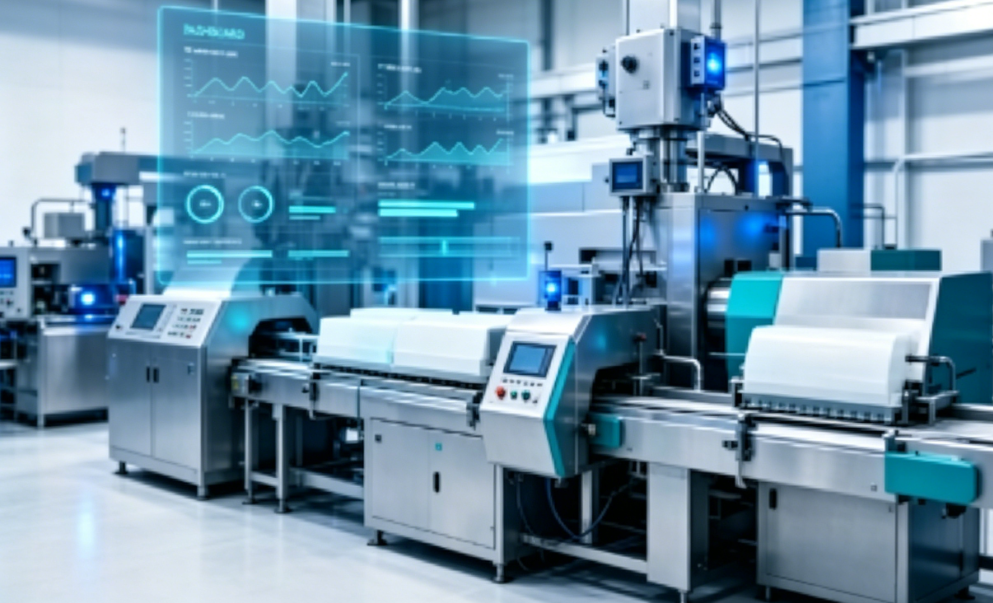
A soap plant running at full capacity still loses money if it cannot see what is happening inside its own machines. Unplanned downtime, inconsistent moisture levels, and manual weigh-checks every two hours—these are not quirks of the industry; they are symptoms of factories that have not yet embraced digitalization.
Across Southeast Asia and Africa, a growing number of soap manufacturers are retrofitting their existing lines with IoT sensors, cloud dashboards, and automated process loops. The results are consistent: throughput gains of 20–30%, scrap reductions of 15–25%, and labor savings that pay for the upgrade within 18 months.
This article walks through three real-world smart factory upgrades on soap production lines, from a 200 kg/h pilot plant to a 1,500 kg/h high-speed operation.
1. What a Smart Soap Factory Actually Looks Like
“Smart” does not mean replacing your saponification reactors and plodders with robots. It means adding sensors and software to the equipment you already own so that every stage of the line—from raw material dosing to final bar weight—runs with less guesswork and more data.
Core Components of a Digital Soap Line
- IoT process sensors: Temperature probes in the crutcher, pressure transducers on the plodder, humidity sensors in the drying tunnel, and load cells under the packaging conveyor.
- Edge gateway / PLC integration: A local controller collects sensor data every 1–5 seconds and pushes it to a cloud platform or on-premise server.
- Dashboard and analytics: Real-time visualizations of throughput, moisture, weight variance, and energy consumption—accessible from any browser or mobile device.
- Automated feedback loops: When a sensor detects a deviation (e.g., moisture above the setpoint), the system automatically adjusts the drying tunnel fan speed or plodder temperature without waiting for a human operator.
| Upgrade Layer | What It Adds | Typical Cost | Payback Period |
|————–|————-|————-|—————-|
| Sensor kit (temperature, pressure, humidity) | Live data at 5 key process points | $3,000–$8,000 | 3–6 months |
| Edge gateway + PLC connection | Data aggregation, local control logic | $5,000–$12,000 | 6–10 months |
| Cloud dashboard (SaaS) | Remote monitoring, trend analysis, alerts | $500–$2,000/month | 2–4 months (savings-based) |
| Automated feedback control | Self-correcting process loops | $10,000–$25,000 | 10–18 months |
According to Mordor Intelligence’s smart manufacturing market report, the global smart factory sector is projected to grow at a CAGR of 13.1% through 2029, with process industries (including soap and detergents) among the fastest adopters in emerging markets.
2. Case Study: 500 kg/h Toilet Soap Line — Indonesia
A mid-size toilet soap producer in Surabaya, Indonesia, was running a 500 kg/h line with manual quality checks every two hours. The plant manager had three persistent problems:
- Moisture drift: Bars exiting the drying tunnel ranged from 12% to 18% moisture depending on ambient humidity, causing weight variance of ±4 g per bar.
- Plodder jams: No early warning. A clog in the extruder cone would halt production for 30–45 minutes while operators disassembled the head.
- Packaging overruns: Manual weight sampling missed underweight bars, leading to customer complaints and occasional regulatory flags.
The Upgrade
The plant installed the following over a two-week shutdown period:
1. 6 IoT sensors: 2 temperature probes in the crutcher, 1 pressure sensor on the plodder cone, 2 humidity sensors in the drying tunnel, and 1 load cell on the packaging belt.
2. Edge gateway: Connected to the existing PLC via Modbus RTU; data pushed to a cloud dashboard every 3 seconds.
3. Automated drying control: When the humidity sensor detected moisture above the 14% setpoint, the drying tunnel fan speed increased automatically by 5–15% until the target was met.
4. Plodder pressure alert: A threshold alarm on the cone pressure sensor sent SMS and dashboard alerts to the shift supervisor 15 minutes before a jam condition—giving the team time to adjust soap temperature or reduce feed rate.
Results After 6 Months
| Metric | Before Upgrade | After Upgrade | Improvement |
|——–|—————|————–|————-|
| Bar moisture variance | 12–18% (±4 g) | 13.5–15% (±1.5 g) | 63% reduction |
| Unplanned plodder downtime | 3.5 hours/week | 0.5 hours/week | 86% reduction |
| Underweight bar complaints | 8 per month | 1 per month | 88% reduction |
| Production throughput | 420 kg/h (effective) | 460 kg/h | 9.5% gain |
| Raw material giveaway | 3.2% | 1.8% | 44% reduction |
| Labor (QC checks) | 2 shifts × 1 inspector | 1 shift × 1 inspector | 50% reduction |
The total upgrade cost was $18,500. Annualized savings from reduced giveaway ($9,600), lower downtime ($14,000), and QC labor cuts ($7,200) totaled $30,800—delivering a full payback in just over 7 months.
3. Case Study: 1,500 kg/h Laundry Soap Line — Nigeria
A large laundry soap manufacturer in Lagos operated a 1,500 kg/h line with three plodders feeding a single high-speed packaging system. The main challenge was synchronizing the three extrusion streams: if one plodder drifted even slightly in output rate, the packaging machine either ran starved or overflowed.
The Upgrade
The factory deployed a full digital synchronization system:
- 9 IoT sensors: 3 pressure sensors (one per plodder), 3 temperature probes, 1 flow-rate sensor on the combined conveyor, 1 weight-check load cell before the packaging infeed, and 1 energy meter on the main drive motor.
- Central PLC with IoT overlay: The existing Siemens PLC was extended with an IoT module that published process data to the plant’s on-premise server via MQTT.
- Dynamic flow balancing: When the weight-check sensor detected an imbalance between the three streams, the PLC automatically adjusted the feed rate on the lagging plodder by ±5% to restore balance—without operator intervention.
- Energy dashboard: The plant manager could now see real-time kWh/kg data, identifying that one plodder was consuming 18% more energy than the other two due to a worn cone. Maintenance was scheduled proactively.
Results After 8 Months
| Metric | Before Upgrade | After Upgrade | Improvement |
|——–|—————|————–|————-|
| Stream synchronization error | ±12% between plodders | ±3% | 75% reduction |
| Packaging starved / overflow events | 14 per week | 2 per week | 86% reduction |
| Effective throughput | 1,280 kg/h | 1,400 kg/h | 9.4% gain |
| Plodder energy efficiency | 0.18 kWh/kg | 0.15 kWh/kg | 17% reduction |
| Maintenance response time | 4–6 hours (reactive) | 30 min (proactive alert) | 92% faster |
| Annual energy savings | — | $22,400 | — |
The total investment was $38,000. Combined annual savings from throughput gains ($45,000), energy reduction ($22,400), and downtime elimination ($16,800) reached $84,200. Payback: 5.4 months.
The ISO 22400-2 standard for key performance indicators in manufacturing operations provides a framework for measuring OEE (Overall Equipment Effectiveness), which is the primary metric these Nigerian and Indonesian factories use to validate their smart upgrades.
4. Implementation Roadmap: From Sensors to Full Automation
Not every soap factory needs a full digital overlay on day one. The most successful upgrades follow a phased approach that builds confidence and ROI at each step.
Phase 1 — Visibility (Weeks 1–4)
- Install 5–8 process sensors at the most critical points: crutcher temperature, plodder pressure, drying tunnel humidity, packaging weight.
- Connect sensors to an edge gateway and deploy a cloud dashboard.
- Train shift supervisors to read the dashboard and respond to alerts manually.
Expected gain: 10–15% scrap reduction from early detection of process drift. Investment: $8,000–$15,000.
Phase 2 — Control (Weeks 5–12)
- Add automated feedback loops on the two most impactful variables: drying tunnel fan speed and plodder temperature regulation.
- Integrate with existing PLCs (Modbus, OPC-UA, or Ethernet/IP).
- Set SMS/email alert thresholds for pressure and weight deviations.
Expected gain: 5–10% throughput increase from stabilized process. Investment: $10,000–$25,000.
Phase 3 — Optimization (Months 4–12)
- Deploy predictive analytics: use 3–6 months of historical data to forecast plodder wear, drying seasonality, and energy spikes.
- Add energy monitoring per machine; target kWh/kg benchmarks.
- Implement dynamic multi-stream balancing for lines with 2+ plodders.
Expected gain: Additional 5–15% throughput and 10–20% energy savings. Investment: $15,000–$30,000.
Total ROI Summary
| Phase | Cumulative Investment | Cumulative Annual Savings | Payback |
|——-|———————|————————–|———|
| Phase 1 (Visibility) | $8,000–$15,000 | $12,000–$20,000 | 5–9 months |
| Phase 2 (Control) | $18,000–$40,000 | $30,000–$50,000 | 6–10 months |
| Phase 3 (Optimization) | $33,000–$70,000 | $50,000–$85,000 | 7–12 months |
For a 500–1,500 kg/h line, the full three-phase upgrade typically costs $33,000–$70,000 and delivers $50,000–$85,000 in annual savings—paying for itself in under 12 months even at the high end.
5. What to Ask Your Equipment Supplier Before Upgrading
Before committing to a smart factory retrofit, clarify these points with your line supplier and IoT integrator:
- PLC compatibility: What communication protocols does your existing PLC support? (Modbus RTU, OPC-UA, Profinet, Ethernet/IP—each requires a different gateway module.)
- Sensor mounting: Can sensors be installed without modifying the machine frame or cutting into process piping? Non-invasive sensors (clamp-on temperature, external humidity) reduce installation risk.
- Data ownership: Does the cloud dashboard store your data on your own server, or on the vendor’s cloud? Who owns the historical dataset if you switch providers?
- Cybersecurity: Is the edge gateway hardened against unauthorized access? Does the system use encrypted MQTT or HTTPS for data transport?
- Training scope: How many hours of operator and supervisor training are included? A dashboard that nobody reads is worthless.
- Maintenance contract: Does the integrator offer annual sensor calibration and firmware updates, or is that your team’s responsibility?
STING Industry’s production line equipment is designed with standardized PLC interfaces that simplify IoT integration—whether you are adding a single sensor or deploying a full digital overlay.
Conclusion
Digitalizing a soap production line is no longer a futuristic concept—it is a practical, phased upgrade that mid-size and large manufacturers in Indonesia, Nigeria, and other emerging markets are already deploying with measurable ROI. Start with visibility (sensors + dashboard), move to control (automated feedback loops), and then optimize (predictive analytics + energy targeting).
The data is clear: factories that can see, measure, and automatically correct their process variables outperform those that rely on manual checks and operator intuition by 20–30% in throughput and 15–25% in waste reduction.
Ready to explore IoT upgrades for your soap line? Contact the STING Industry engineering team for a free digitalization feasibility assessment. We will evaluate your existing equipment, identify the highest-impact sensor points, and deliver a phased implementation plan with projected ROI.