
Crude palm oil futures have fallen to their lowest level in about eight months, and the headlines read like relief for soap makers. They are not — at least not where it counts. While the benchmark price of clean fat has softened, the discounts on “cheap” fatty feedstocks have collapsed. Palm fatty acid distillate now trades above the CPO outright, used cooking oil is bid up by renewable-fuel buyers on two continents, and the only genuinely cheap grades left are exactly the ones a standard saponification line cannot digest. The margin lever in soap manufacturing has quietly moved upstream: from what you pay per tonne of oil to what your pretreatment train can actually process.
Key Takeaways
- Malaysian CPO sits near US$1,039/MT (RM4,225–4,300), an eight-month low, after September stocks hit a record 3.51 million tonnes (+24.5% MoM) and Indonesia cut its November reference price to US$979/MT — yet none of that softness reached the by-product grades.
- The by-product ladder has inverted: PFAD traded at US$1,063/MT FOB Malaysia in August — above the CPO outright — while UCO reached US$1,188/MT FOB China and US$1,310/t delivered to ARA. Renewable-fuel demand, not soap demand, now sets these prices.
- Every 1% of free fatty acid in the feedstock adds roughly 1.42 kg of extra caustic per tonne of oil and converts about 11 kg of fatty matter per tonne into soapstock instead of finished bar — a direct, calculable penalty for running dirty fat on an unprepared line.
- The global oils & fats processing equipment market is heading for US$41.2 billion in 2026 (+5.8%); refining is the largest segment (34.7% of demand), and the fastest growth sits exactly where soap plants need it: physical refining equipment +8.9%/yr, enzymatic degumming +11.2%/yr, modular 50–200 t/d lines +14.2%.
- China’s UCO exports rose 55% YoY to 2.57 million tonnes (Jan–Aug 2026), with Europe the largest buyer — evidence that the waste-feedstock trade is industrialising and that pretreatment capacity is becoming a tradable, strategic asset.
- Procurement consequence for Q4: specify the pretreatment envelope — worst-case FFA, phosphorus, moisture and metals — alongside the saponification line itself, and decide chemical versus physical deacidification on your glycerin plan, not on a datasheet default.
1. The Headline Is Cheap Palm. The Ladder Is Not.
Start with the headline numbers, because they explain why buyers are tempted to relax. MPOB’s September data showed Malaysian CPO production up 16.5% month-on-month at 2.11 million tonnes, exports down 12.1%, and closing stocks up 24.5% to 3.51 million tonnes — a record. By 7–9 November the benchmark futures contract had broken below RM4,300 and touched RM4,225, roughly US$1,039/MT and the weakest print in about eight months. Indonesia cut its November reference price by roughly 6% to US$979/MT, pulling the export duty down to US$124/MT alongside a levy adjustment of about 20%. On paper, fat is getting cheaper.
But the grades a soap plant actually buys when it wants a discount did not follow the benchmark down. The feedstock ladder as of late 2026 looks like this:
| Feedstock grade | Price (late 2026) | Typical FFA / quality burden |
|---|---|---|
| CPO, Malaysia (futures basis) | ~US$1,039/MT (RM4,225–4,300) | Clean reference; needs conventional refining |
| Soap noodles 80:20, FOB Tanjung Priok | US$1,070/MT in Q3 (−7.4% QoQ) | None — the finished intermediate |
| PFAD, FOB Malaysia | US$1,063/MT (August assessment) | 50–95% FFA; above the CPO outright |
| UCO, FOB China / delivered ARA | US$1,188 / US$1,310 per tonne | Variable; water, solids, polymers, metals |
| POME oil, FOB Malaysia | US$1,170/MT (Sept 17, +7% since March) | High acidity, high impurity load |
| Acid oil, global average | US$844/MT Q3 (+2.1% QoQ; Malaysia 735, India 870, Germany 950) | The cheapest grade — and the dirtiest |
Assessments: Fastmarkets (UCO), Expert Market Research (PFAD, acid oil, soap noodles), Palm Oil Economics / Bernama (CPO futures), ChemAnalyst (soap noodles FOB Tanjung Priok).
Two inversions stand out. First, PFAD — historically the soap industry’s discount feedstock, a physical-refining by-product sold below the crude it came from — now clears the CPO outright. Expert Market Research puts soap and detergent at about 36% of PFAD demand and biodiesel at 33%; renewable-fuel buyers are no longer willing to let the soap industry have the discount. Second, used cooking oil has become an industrial commodity with its own export infrastructure: China shipped 2.57 million tonnes in January–August 2026, up 55% year-on-year, with Europe taking 850,000 tonnes (+24%) and the US Gulf Coast assessment at US$1,554/t. UCO rose 16% between March and September while POME climbed 7% — both outpacing the fall in the CPO benchmark.
The only grade still trading at a real discount is acid oil, at a global average of US$844/MT — and the discount is precisely proportional to its quality burden. That is the arbitrage this article is about.
2. The Chemistry Penalty of Dirty Fat
The economics of high-FFA feedstock are not vague. They are stoichiometry, and they land on three line items: caustic, yield and glycerin.
Caustic consumption rises linearly with FFA. Neutralising free fatty acids with sodium hydroxide consumes alkali in direct proportion: each 1% of FFA in a tonne of oil requires about 1.42 kg of NaOH on a pure basis (the 40/28.2 molar ratio of NaOH to oleic acid). For context, the baseline saponification charge for a standard 80:20 palm/palm-kernel blend at 78% TFM is already 121.4 kg of NaOH (100% basis) per tonne of soap — or 124–127 kg in practice, once the 1–2% alkali excess and 98% flake purity are priced in. A line switched from refined feedstock (0.5% FFA) to crude (5% FFA) adds roughly 6.4 kg of NaOH per tonne of oil for neutralisation alone — before the excess charge needed to push the reaction to completion.
Yield leaks into soapstock. Each 1% of FFA neutralised converts about 10 kg of fatty matter per tonne of oil into sodium soap — roughly 10.8 kg on the 282→304 molecular-weight conversion — which leaves the process as soapstock rather than finished bar. That stream then needs acidulation, storage or disposal, each with its own equipment and effluent footprint (a topic this newsletter covered in the water-recycling analysis of 12 October). Multiplied across a 20-tonne-per-day oil intake, a 5% FFA feed wastes the equivalent of about one tonne of fatty matter per day to the soapstock loop.
The glycerin credit thins out. As last week’s analysis documented, a typical soap line yields 30–35 kg of glycerin per tonne of bar — but only from the triglyceride fraction. Neutralised FFAs produce soap and water, not glycerol; the glycerol associated with hydrolysed fat has already left the molecule before the oil arrives. High-FFA feedstock therefore dilutes the by-product revenue that the refining line is supposed to generate, stacking a quiet loss on top of the loud one.
Colour, odour and oxidation carry through. Beyond FFA, low-grade fats bring phospholipids, metal ions, water and polymeric oxidation products. Metals catalyse further oxidation in storage and in the bar; unremoved colour and odour volatiles surface as grey bars and off-notes that no fragrance package fully masks. The pretreatment train exists to strip exactly these — and its sizing, not the saponification reactor’s, is what determines whether a plant can chase the US$844 acid-oil arbitrage at all.
3. Anatomy of the Pretreatment Train
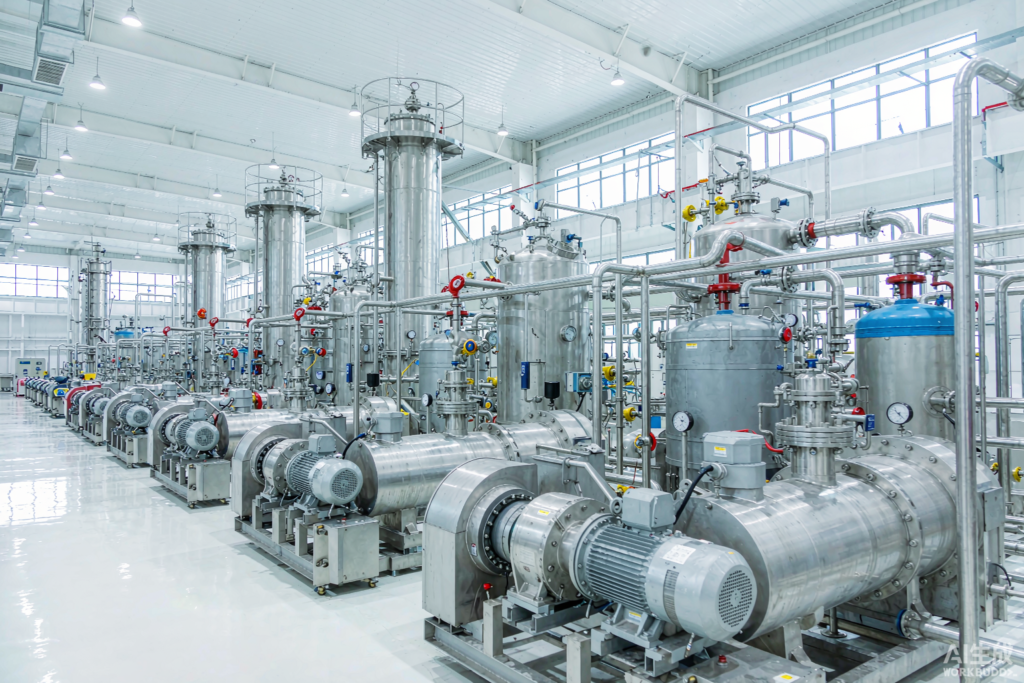
For readers accustomed to thinking of the front end as “tanks and a pump”, the modern pretreatment section is a process plant in its own right. Its stages, and the checkpoints that separate a workable offer from a showroom one:
| Stage | Core equipment | What it removes | Spec checkpoint |
|---|---|---|---|
| Intake & conditioning | Heated storage with agitation, screening, filter presses or disc centrifuges | Free water, gross solids (critical for UCO/POME feeds) | Envelope: name the worst-case water and M&I the plant will accept |
| Degumming | Acid (phosphoric/citric) dosing and reaction vessels; or enzymatic degumming skids | Phospholipids, metal ions, chlorides | Enzymatic routes are the fastest-growing option (+11.2%/yr) on chemical savings and effluent load |
| Deacidification | Caustic dosing + soapstock centrifuge (chemical); or steam stripping column (physical) | Free fatty acids | Chemical vs physical is a glycerin-and-co-product decision, not a default |
| Bleaching | Vacuum bleaching reactors, earth dosing systems, spent-earth filters | Pigments, oxidation products, residual metals | Earth consumption scales with FFA and impurities; spent-earth handling is now its own equipment niche |
| Deodorization / FFA stripping | Packed or cup-type deodorizers, steam ejectors, FFA scrub-recovery | Odour volatiles, residual FFA (as distilled fatty acid) | Ask for the stripped-FFA recovery rate — it is a salable co-product, not a loss |
| Heat integration | Counter-flow economisers, multi-stage heat recovery | Steam and utility waste | 2026 benchmark: 10–15% steam reduction via recovery networks |
| Dosing & blending | Multi-fat blend tanks with mass-flow dosing | Formulation variance between feeds | ≤0.1% dosing accuracy enables continuous swing between palm, PKO, tallow and acid oils |
Vendors are already repositioning around this scope: Myande now markets integrated UCO/HVO feedstock pretreatment trains rated 50–2,000 t/d, explicitly targeting metal-ion, chloride and phospholipid removal for waste-origin oils — the same front end a soap plant running acid oils needs.
4. What the Equipment Market Says
The upstream equipment market has already priced in this shift. Global oils & fats processing equipment demand is projected at US$41.2 billion in 2026, up 5.8% — a modest deceleration from 2025’s 6.9% as the APAC refining build-out matures, with the market expected to exceed US$54 billion by 2030 (about 6.1% CAGR). The growth is not evenly spread:
| Segment (2026) | Reading | Why it matters for soap plants |
|---|---|---|
| Total market | US$41.2B, +5.8% YoY | Front-end capex is abundant and competitive |
| Refining equipment share | 34.7% of demand (largest segment) | Deacidification/bleaching/deodorization scope is where vendors invest |
| Pretreatment + extraction share | 41.2%, but growth slowest at 4.3% | Classic oilseed pretreatment is mature; waste-feed pretreatment is not |
| Physical refining equipment | +8.9%/yr | Aligns with the FFA-stripping route and distilled fatty acid co-products |
| Enzymatic degumming | +11.2%/yr | Lower chemical consumption and effluent load — pairs with ZLD programmes |
| Industrial oils & oleochemicals equipment | +9.7%/yr — the fastest application segment | Fatty acid and glycerin trains: the same chemical family as soap |
| Modular compact lines (50–200 t/d) | Sales +14.2% YoY | The entry format for emerging-market soap plants chasing cheap feedstock |
| North America | US$8.8B, +6.8% | Biodiesel/SAF pull on pretreatment capacity |
| European Union | US$7.6B, +7.3% | CBAM and RED III drive waste-oil pretreatment and hydrotreatment demand |
| Asia-Pacific | 42.6% of global demand, +5.1% | Origin-side integration: noodle and fatty-acid producers add front ends |
Source: GEP Research, global oils & fats processing equipment outlook 2026 (GEPX171SC7).
The regional pattern deserves a note. North America and the EU are the fastest-growing developed markets precisely because renewable-fuel policy is pulling fatty feedstock into fuel — the same force that raised PFAD and UCO prices against soap makers. APAC remains the volume centre at 42.6% of demand, and it is where the vertical-integration move documented in September’s East Africa analysis is repeating: noodle producers and fatty-acid plants adding their own pretreatment and saponification front ends to capture the spread the pure finishing plants now pay away.
5. Q4 2026 Procurement Checklist: Specifying the Front End
For plants weighing a pretreatment investment before the next feedstock cycle, the specification decisions that matter most:
- Specify a feedstock envelope, not a recipe. Name the worst-case FFA, phosphorus, water and metals-and-insolubles the front end must process, and make the vendor guarantee finished-oil quality against that envelope — not against a hand-picked trial lot.
- Decide chemical vs physical deacidification on the glycerin plan. Chemical neutralisation generates soapstock that needs acidulation and ties into the glycerin recovery train; physical refining sends FFA to the deodorizer as distilled fatty acid — a salable co-product, but one that forfeits soapstock chemistry. The right answer depends on which by-product line (this newsletter’s 2 November and 12 October analyses) the plant is already committed to.
- Demand heat-integration numbers in the offer. Counter-flow recovery networks are a 2026 standard delivering 10–15% steam savings; a deodorizer quoted without economisers is quoting an operating-cost premium.
- Size on FFA swing, not nameplate. A 2 TPH finishing line consumes roughly 20 t/day of oil; if the strategic bet is acid oils at 20–30% FFA, neutralisation, bleaching and effluent capacity must be sized for the dirt case, with clean feedstock as the easy case.
- Match the modular trend to the plant reality. The 50–200 t/d skid segment growing at 14.2%/yr exists for a reason: it fits the emerging-market plants profiled in October’s small-format analysis, with fat dosing accuracy (≤0.1% mass-flow) enabling swing between feedstock grades as prices move.
- Use the ladder as a trigger. When PFAD trades at or above CPO — as it does now — pretreatment capex pays back faster and the negotiation leverage shifts to the plant that can process the grades nobody else wants.
Outlook: A Two-Speed Front End
Expect the bifurcation to sharpen through 2027. Noodle-buying finishing plants — the format behind October’s small-format boom — remain insulated from the front-end question and will keep buying the intermediate at US$980–1,080/MT (the global H2 forecast band). Vertically integrated producers, meanwhile, are converting the by-product inversion into an acquisition argument: every dollar of PFAD premium and every point of UCO growth is a dollar earned by whoever owns degumming, bleaching and stripping capacity. The pretreatment train will not appear on a soap company’s org chart. It will appear in its gross margin — as the machine decision it has quietly become.
Sources
- Palm Oil Economics, daily briefs 7–9 November 2026 — MPOB September data, futures below RM4,300, Indonesian November reference price and levy adjustment.
- Bernama, 2 November 2026 — CPO futures close, record Malaysian stocks (~3.5 million tonnes), October export recovery.
- Expert Market Research, PFAD Price Trend and Forecast 2026–2027 (updated 16 October 2026) — US$1,063/MT FOB Malaysia (August); demand split 36% soap/detergent, 33% biodiesel; Indonesian B40 retained, B50 postponed, CPO export levy raised to 12.5% from March.
- Expert Market Research, Acid Oil Price Trend and Forecast 2026–2027 — Q3 2026 regional assessments (Germany 950, India 870, Malaysia 735, global 844 USD/MT).
- Fastmarkets via UkrAgroConsult, November 2026 — China UCO exports +55% YoY to 2.57 Mt (Jan–Aug); UCO US$1,188/t FOB China, US$1,310/t ARA, US$1,554/t USGC; EU imports +8%.
- Fastmarkets, September 2026 — SAF/HVO production-cost assessments; China bulk UCO US$1,020 → 1,182/t (+16%); POME FOB Malaysia US$1,090 → 1,170/t (+7%).
- ChemAnalyst, November 2026 — soap noodles FOB Tanjung Priok Q3 2026 at US$1,070/MT (−7.44% QoQ; Q1 1,085, Q2 1,156); B40 retained through 2026.
- Expert Market Research, Soap Noodles Price Trend and Forecast 2026–2027 — global H2 2026 band US$980–1,080/MT; Europe highest at US$1,150–1,260/MT.
- GEP Research, Global Oils & Fats Processing Equipment Market Strategic Outlook 2026 (GEPX171SC7) — US$41.2B (+5.8%), segment shares and growth rates, regional demand, modular-line growth.
- CausticSodaCo, 2026 — NaOH dosage derivation for 80:20 palm/PKO blend at 78% TFM (121.4 kg/t basis; 124–127 kg practical).
- Myande Group (Made-in-China listing) — integrated UCO/HVO feedstock pretreatment systems, 50–2,000 t/d, targeting metal-ion, chloride and phospholipid removal.
- Vic Machinery, 2026 — edible-oil processing equipment trends: modular refining skids (degumming/neutralisation/bleaching/deodorization), heat-recovery networks cutting steam 10–15%.
Derived figures marked “calculated” (caustic per 1% FFA, soapstock mass) are stoichiometric conversions from published molecular weights, not vendor quotations. Price assessments are dated observations, not live quotations. STING supplies complete toilet and laundry soap production lines of 50–2,000 kg/h.