
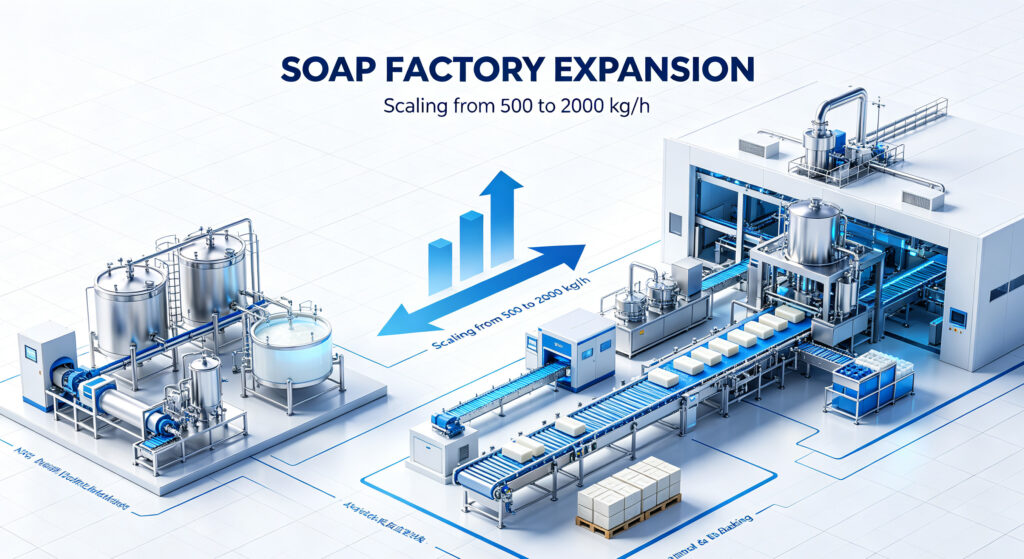
Every soap manufacturer hits the same wall: the line that served you well at 500 kg/h cannot simply run faster to hit 2,000 kg/h. Saponification reactors need longer cooling times. Plodders choke on higher throughput. Packaging lines bottleneck at the cartoner. Scaling up demands targeted equipment upgrades at every stage—and the sequence matters more than the budget.
This guide maps the expansion path from a mid-scale soap line to industrial capacity, identifies the bottlenecks that kill throughput, and provides a phased investment plan with ROI projections for each upgrade.
1. Capacity Bottleneck Map: Where Your Line Actually Stops
Before buying any equipment, audit your current line to find the true throughput ceiling. The bottleneck is rarely where you think it is.
Common Bottleneck Points by Production Stage
| Production Stage | 500 kg/h Equipment | Bottleneck at Scale | Root Cause |
|—————–|——————–|——————–|————|
| Saponification | Batch reactor (single, 500 kg/batch) | 800 kg/h | Reactor cooling time limits cycle frequency |
| Drying | Vacuum flash dryer (single chamber) | 700 kg/h | Moisture removal capacity per unit time |
| Mixing/Crutching | Single-arm crutcher (200 L) | 600 kg/h | Batch cycle time + discharge time |
| Extrusion | Single-plodder (200 mm) | 1,200 kg/h | Plodder can handle more—upstream starvation |
| Cutting | Automatic cutter (single lane) | 1,000 kg/h | Cut rate sufficient; knife wear increases |
| Packaging | Pleat wrapper (single lane) | 500 kg/h | Wrapper speed fixed; no buffer capacity |
Key Insight
At 500 kg/h, the packaging line is often the hidden bottleneck. The plodder may be capable of 1,200 kg/h, but if the wrapper only runs at 500 kg/h, the entire line throttles back to match. Expanding saponification capacity without addressing packaging first yields zero net throughput gain.
2. Phased Expansion Plan: The Right Upgrade Sequence
Expansion should follow a specific sequence: packaging first, then saponification, then finishing. Upgrading upstream before downstream creates surplus capacity that sits idle.
Phase 1: Packaging and Downstream (Target: 800 kg/h)
| Upgrade | Equipment | Capital Cost | Throughput Gain | Payback |
|———|———–|————-|—————-|———|
| Dual-lane pleat wrapper | Second wrapper + conveyor merge | $18,000–$25,000 | +300 kg/h | 3.5 months |
| Cartoning machine upgrade | High-speed cartoner (80 boxes/min) | $12,000–$20,000 | +200 kg/h | 4.0 months |
| Buffer conveyor between cutter and wrapper | Accumulation table (3 m) | $4,000–$6,000 | +100 kg/h (reduced starvation) | 1.5 months |
| Phase 1 Total | | $34,000–$51,000 | 800 kg/h achieved | 3.2 months |
STING Industry’s soap packaging equipment includes dual-lane wrapping and high-speed cartoning systems designed to match upstream throughput without creating buffer overflows.
Phase 2: Saponification and Drying (Target: 1,200 kg/h)
| Upgrade | Equipment | Capital Cost | Throughput Gain | Payback |
|———|———–|————-|—————-|———|
| Second batch reactor | 500 kg reactor with heat recovery | $25,000–$35,000 | +500 kg/h | 5.0 months |
| Continuous saponification column | 1,000 kg/h continuous unit | $40,000–$55,000 | +700 kg/h (replace batch) | 6.5 months |
| Dual-chamber vacuum dryer | Second flash dryer chamber | $15,000–$22,000 | +400 kg/h | 3.8 months |
| Larger crutcher | 500 L dual-arm crutcher | $8,000–$12,000 | +300 kg/h | 2.7 months |
| Phase 2 Total | | $88,000–$124,000 | 1,200 kg/h achieved | 4.6 months |
For plants committed to sustained growth, the continuous saponification column is the strategic choice. It eliminates batch cycle time entirely and scales linearly with feed rate. STING Industry’s saponification systems offer both batch and continuous configurations with integrated heat recovery.
Phase 3: Finishing and Full Industrial Scale (Target: 2,000 kg/h)
| Upgrade | Equipment | Capital Cost | Throughput Gain | Payback |
|———|———–|————-|—————-|———|
| Twin-plodder (300 mm + 200 mm) | Double-stage plodder with vacuum | $30,000–$45,000 | +800 kg/h | 3.8 months |
| Multi-lane cutter (3 lanes) | Rotary cutter with lane splitting | $12,000–$18,000 | +600 kg/h | 2.5 months |
| Triple-lane wrapper + cartoner | 3-lane wrapping system | $35,000–$50,000 | +800 kg/h | 4.4 months |
| Palletizing system | Automatic case packing + palletizer | $20,000–$35,000 | Eliminates manual bottleneck | 5.0 months |
| Phase 3 Total | | $97,000–$148,000 | 2,000 kg/h achieved | 3.9 months |
At 2,000 kg/h, manual palletizing becomes the final bottleneck. A single operator can handle 500 kg/h of case stacking, but at industrial scale, automated packing and palletizing equipment is essential to maintain line speed.
3. Infrastructure Requirements at Each Scale
Equipment alone does not deliver higher throughput. The supporting infrastructure—power, space, utilities, and labor—must scale in parallel.
Infrastructure Scaling Matrix
| Parameter | 500 kg/h | 800 kg/h | 1,200 kg/h | 2,000 kg/h |
|———–|———-|———-|————|————|
| Floor space (production area) | 400 m² | 600 m² | 800 m² | 1,200 m² |
| Electrical power | 75 kW | 120 kW | 180 kW | 280 kW |
| Steam demand | 0.5 ton/h | 0.8 ton/h | 1.2 ton/h | 2.0 ton/h |
| Compressed air | 3 m³/min | 5 m³/min | 8 m³/min | 12 m³/min |
| Cooling water | 5 m³/h | 8 m³/h | 12 m³/h | 20 m³/h |
| Production staff | 6–8 | 8–10 | 10–14 | 14–18 |
| Shift pattern | 1 shift | 1–2 shifts | 2 shifts | 2–3 shifts |
Critical Infrastructure Pitfalls
- Steam capacity: Many plants upgrade reactors without upgrading the boiler. A 1,200 kg/h continuous saponification column requires 1.2 ton/h of steam—double the 500 kg/h baseline. Boiler capacity must be verified before reactor procurement.
- Electrical supply: Motor starting currents spike at 6× rated power. At 2,000 kg/h with twin-plodders starting simultaneously, the peak demand reaches 400 kW for 3 seconds. Ensure your transformer and switchgear can handle it.
- Floor layout: Expansion is not just adding machines in a row. The production flow must maintain a logical sequence: saponification → drying → mixing → extrusion → cutting → packaging → palletizing. Cramped layouts create cross-traffic and material handling conflicts that reduce effective throughput by 10–15%.
4. Financial Model: Total Investment vs. Revenue Growth
The expansion investment must be evaluated against the incremental revenue it generates. Below is a simplified model for a typical bar soap manufacturer selling at $0.35/bar wholesale.
Revenue and Cost Projection
| Metric | 500 kg/h | 800 kg/h | 1,200 kg/h | 2,000 kg/h |
|——–|———-|———-|————|————|
| Daily output (8-h shift) | 4,000 kg | 6,400 kg | 9,600 kg | 16,000 kg |
| Bars per day (100 g/bar) | 40,000 | 64,000 | 96,000 | 160,000 |
| Daily revenue (at $0.35/bar) | $14,000 | $22,400 | $33,600 | $56,000 |
| Annual revenue (300 days) | $4.2M | $6.72M | $10.08M | $16.8M |
| Variable cost per bar | $0.18 | $0.17 | $0.16 | $0.15 |
| Annual variable cost | $2.16M | $3.41M | $4.61M | $7.2M |
| Annual gross margin | $2.04M | $3.31M | $5.47M | $9.6M |
| Gross margin % | 48.6% | 49.3% | 54.3% | 57.1% |
Cumulative Investment and Payback
| Expansion Phase | Investment | Incremental Annual Margin | Phase Payback |
|—————-|———–|————————–|—————|
| Phase 1 (→ 800 kg/h) | $51,000 | $1,270,000 | < 1 month | | Phase 2 (→ 1,200 kg/h) | $124,000 | $2,160,000 | < 1 month | | Phase 3 (→ 2,000 kg/h) | $148,000 | $4,130,000 | < 1 month | | Total (500 → 2,000 kg/h) | $323,000 | $7,560,000 | < 1 month |
Note: Phase payback periods are extremely short because incremental margin at scale far exceeds equipment cost. The real constraint is market demand and sales capacity, not equipment payback. Each phase should be timed to match confirmed order growth.
According to Statista’s global cleaning products forecast, emerging markets in Africa and Southeast Asia are driving 5–6% annual growth in bar soap consumption, creating sustained demand for expanded production capacity.
5. Risk Mitigation: What Can Go Wrong During Expansion
Expansion projects carry three primary risks: demand mismatch, integration failure, and cash flow timing.
Risk Matrix
| Risk | Likelihood | Impact | Mitigation Strategy |
|——|———–|——–|———————|
| Demand shortfall after Phase 2 upgrade | Medium | High (idle capacity burns cash) | Expand only when 70% of current capacity is sold; sign advance orders before committing capital |
| New equipment fails to integrate with existing PLC | Medium | High (line stops during commissioning) | Specify common PLC platform (e.g., Siemens S7) for all new equipment; require vendor integration testing before shipment |
| Cash flow gap between investment and revenue | Low–Medium | Medium (working capital strain) | Phase investments over 12–18 months; lease high-cost items (reactors, palletizers) instead of purchasing outright |
| Regulatory compliance delays (environmental permits for expanded boiler/effluent) | Medium | Medium | Initiate permit applications 6 months before equipment delivery; engage local environmental consultant |
| Skilled labor shortage at 2,000 kg/h scale | Medium | Medium (quality drops with inexperienced operators) | Begin training program 3 months before commissioning; recruit shift supervisors from established soap manufacturers |
Integration Best Practices
- Standardize communication protocols: All new equipment must speak the same PLC language. Insist on Profinet or EtherNet/IP compatibility before purchase.
- Commissioning sequence: Start with the downstream equipment first (packaging, palletizing). Run it with simulated product before connecting upstream. This verifies that downstream can handle the target rate independently.
- Parallel operation: During commissioning, run the old line and the new line simultaneously for 2–4 weeks. This provides a fallback if the new equipment needs adjustments and prevents production interruption.
The ISO 9001 quality management framework provides a structured approach to managing change during factory expansion, ensuring that scale-up does not compromise product consistency.
Conclusion: Expand in Sequence, Not in Parallel
The most expensive mistake in soap factory expansion is upgrading upstream before downstream. A faster reactor feeding a slower wrapper produces inventory, not revenue. The correct sequence—packaging first, saponification second, finishing third—ensures that every investment immediately translates into sellable output.
The financial model confirms that expansion pays back rapidly at every stage, provided market demand exists to absorb the additional capacity. The risk matrix shows that integration failure and demand shortfall are the two threats worth managing proactively.
Next Steps
- Audit your current line: Measure actual throughput at each stage for 5 consecutive production days. The lowest stage is your true bottleneck—and the first upgrade target.
- Verify demand: Confirm that you are selling at least 70% of current capacity before committing to Phase 1 investment.
- Request a line assessment: STING Industry provides free production line audits that identify bottlenecks and recommend phased upgrade plans tailored to your product mix and target markets.
Planning a capacity expansion? STING Industry designs, manufactures, and commissions integrated soap production lines from 200 to 2,000 kg/h—with phased upgrade paths built into every installation. Contact our engineering team at info@sting-industry.com or request a line assessment through our bar soap machine catalog to get started.
STING Industry — Saponification Equipment | Bar Soap Machines | Soap Packaging | Packing & Palletizing