
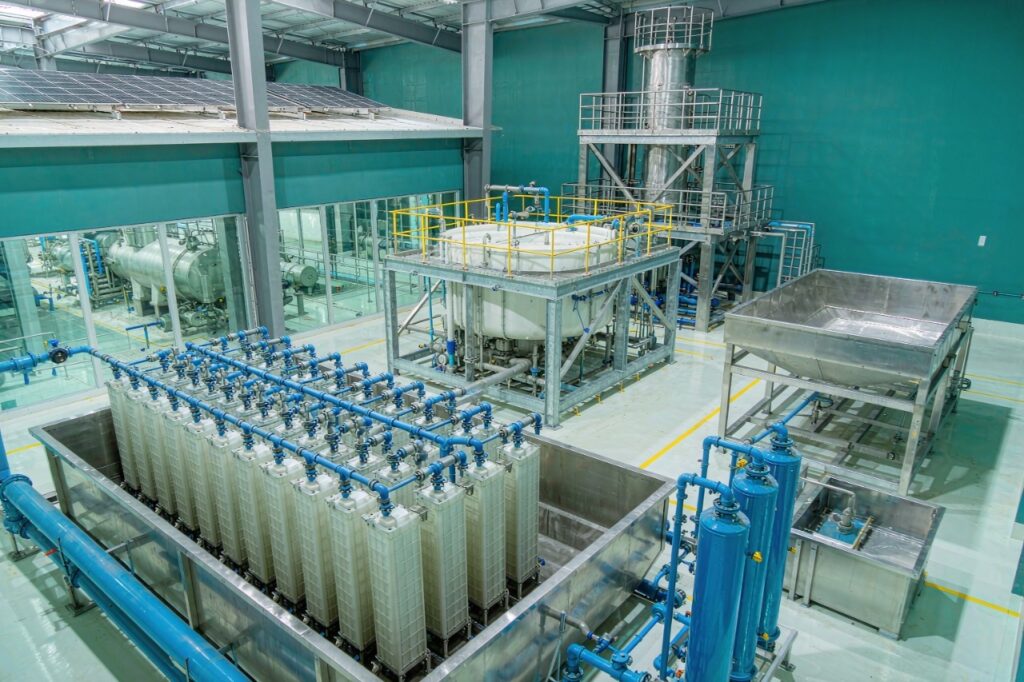
For most of the last decade, a soap factory’s environmental scorecard was written by its smokestack. Energy intensity, steam demand, boiler fuel and, more recently, rooftop solar drew the headlines and the capital. Water sat quietly in the background, treated as a cheap utility that could be drawn from a borehole and pushed to a municipal drain.
That assumption is now breaking on two fronts at once. Regulators are tightening effluent limits on the exact pollutant profile soap plants produce — high chemical oxygen demand (COD), high oil and grease, surfactants and a stubbornly alkaline pH — while water itself is becoming a line item that finance directors scrutinise rather than absorb. The result is a quiet but measurable shift in equipment demand: soap producers are buying water treatment and reuse systems at a pace normally reserved for production machinery.
Key Takeaways
- The global industrial wastewater treatment equipment market is estimated at USD 18.5 billion in 2026, with China alone accounting for roughly 32% — about USD 6 billion.
- The membrane bioreactor (MBR) segment reached USD 4.5–5.0 billion in 2026 and is growing at 8–10% annually, outpacing the wider membrane stack for the first time.
- A well-designed zero liquid discharge (ZLD) train recovers 95–98% of process water, with roughly 63% from reverse osmosis and another 25–26% from an MVR evaporator distillate.
- Effluent treatment typically costs 8–15% of production line CAPEX; ZLD adds a further 40–60% on top of that, making it a decision for water-scarce or high-fee markets only.
- Membrane separation can lift soap base purity above 99.5% while cutting salt consumption by 80% and water use by up to 60–90% — treating compliance and product quality as one problem.
Why Soap Effluent Does Not Behave Like Normal Wastewater
A soap plant’s effluent is chemically distinct from almost any other industrial stream. A single batch saponification reactor discharges a load that, untreated, can carry a biochemical oxygen demand (BOD) measured in the thousands of milligrams per litre — 50 to 100 times the concentration of domestic sewage. The pollutants are not exotic, but they are concentrated and mutually reinforcing: free fatty acids and oils from the reaction, alkalis from lye carryover, dissolved salts generated as saponification by-products, suspended soap particles, and surfactants from syndet or laundry-bar lines.
The gap between what comes out of the reactor and what a discharge permit allows is enormous. The table below sets the two side by side.
| Parameter | Raw Soap Effluent | Typical Discharge Limit |
|---|---|---|
| pH | 10–13 | 6.5–8.5 |
| BOD₅ (mg/L) | 800–2,500 | 30–50 |
| COD (mg/L) | 1,500–5,000 | 125–250 |
| Oil & Grease (mg/L) | 200–600 | 10–15 |
| Total Suspended Solids (mg/L) | 300–800 | 35–60 |
| Surfactants (mg/L) | 50–300 | 0.5–2 (MBAS) |
Sources: WHO Effluent Quality Guidelines; EU Water Framework Directive 2000/60/EC.
Closing that gap is not a matter of a single filter. It requires a sequenced train — primary screening and equalisation, physicochemical fat removal, biological treatment, and then a polishing stage — and the sizing of each stage is driven by the volume and peak-to-average ratio of the stream, not by the tonnage of the plant alone.
The Market Behind the Machinery
The demand shift is visible in the numbers. Independent 2026 market research puts the global industrial wastewater treatment equipment market at approximately USD 18.5 billion, with China representing about 32% of that figure — a domestic market above USD 6 billion. The forecast compound annual growth rate through the decade sits near 6.8%, meaningfully above the broader water treatment sector, which itself reflects how hard industrial buyers are pushing on reuse rates and discharge compliance rather than simply on capacity.
Within that market, two equipment classes are growing fastest: membrane systems and advanced oxidation reactors. Membrane bioreactors have moved from a niche municipal technology to a mainstream industrial one.
| Segment | 2026 Value / Share | Growth Signal |
|---|---|---|
| Industrial wastewater equipment (total) | ~USD 18.5 bn | ~6.8% CAGR |
| Membrane bioreactor (MBR) | USD 4.5–5.0 bn | 8–10% CAGR; APAC ~40% |
| MBR share of total membrane spend | ~17–19% | Rising faster than MF/UF stack |
| MBR permeate quality | TSS <5 mg/L, turbidity <1 NTU | RO-ready without extra filtration |
| MBR specific energy | 0.45–0.60 kWh/m³ | Falling with anti-fouling membranes |
Sources: GEP Research industrial wastewater equipment outlook (2026); Zhongsheng Environmental MBR market analyses (2026); Verified Market Research MBR update (2026).
Two structural forces are doing most of the pushing. The first is regulatory: the revised EU Urban Wastewater Treatment Directive now carries mandatory reuse targets running into the billions of cubic metres by 2030, while China’s amended GB 18918 standards and tighter industrial-park water-recycling goals above 75% have pushed park operators toward membrane processes over conventional activated sludge. The second is economic: in water-stressed regions, industrial reuse tariffs of USD 1.50 to 3.00 per cubic metre make membrane permeate directly competitive with the mains supply, and collapse the downstream load on reverse osmosis.
From Compliance to Closed Loop: The ZLD Arithmetic
Where discharge fees are high or water is scarce, the logic extends past treatment and into zero liquid discharge. A modern ZLD train chains four stages: dissolved air flotation to strip fats and oils, a membrane bioreactor to break down the organic load, reverse osmosis to split clean permeate from brine, and a mechanical vapour recompression (MVR) evaporator followed by a crystalliser to drive the brine to solid cake.
The water balance is the part worth understanding, because it explains why ZLD is expensive but not irrational.
| Stream (100 m³/day basis) | Flow | Recovery / Fate |
|---|---|---|
| Raw soapstock / process water | 100% | Feed to DAF |
| DAF effluent | ~95% | Forward to equalisation |
| MBR permeate | ~90% | Forward to RO |
| RO permeate (reused) | ~63% | Reused in plant |
| MVR distillate (reused) | ~25.5% | Reused in plant |
| Crystalliser cake (solid) | 0.6–0.8% | Landfill or waste-to-energy |
Source: Zhongsheng Environmental ZLD sizing guide for soapstock water (2026).
The headline is a 95–98% overall water recovery, with the residual leaving the site as a small volume of solid cake. That last 2–5% is what distinguishes true ZLD from minimum liquid discharge, and it is exactly what regulators and lenders increasingly ask to see documented in a CAPEX defence. For a soap plant whose water intensity sits at 2.5 to 4.5 kilolitres per tonne of product, recovering most of that stream changes the operating cost base permanently.
A note on scale: ZLD is not the right answer for every plant. It adds 40–60% to the cost of a conventional effluent treatment plant and is economically warranted only where discharge fees are very high or fresh water is genuinely scarce. For most mid-size plants, a well-sized membrane-based reuse loop delivers the majority of the benefit at a fraction of the capital.
What It Costs, and What It Returns
The common objection is that a treatment plant is a cost centre with no visible return. The economics say otherwise, particularly when the avoided costs of non-compliance are counted honestly. Rules of thumb from the equipment side put effluent treatment at 8–15% of a production line’s total capital expenditure, with operating cost typically running USD 0.80 to 2.50 per cubic metre of treated effluent depending on the technology and local energy prices.
Configuration scales with plant size. A 50–150 kg/hr artisan line generating 5–15 m³/day needs little more than screening, a grease trap, equalisation, dissolved air flotation and a small aerobic reactor. By the time a plant reaches 1,200–2,000 kg/hr and 120–200 m³/day, the recommended train becomes a full MBR system with reclaimed-water loops and online monitoring — a materially different investment with a materially different return.
| Plant Capacity | Daily Effluent | Recommended Configuration | Indicative CAPEX (USD) |
|---|---|---|---|
| 50–150 kg/hr | 5–15 m³/day | Screen + grease trap + equalisation + DAF + SBR | 25,000–60,000 |
| 150–500 kg/hr | 15–50 m³/day | Screen + API separator + equalisation + DAF + CAS + sand filter | 60,000–160,000 |
| 500–1,200 kg/hr | 50–120 m³/day | DAF + CAS or MBR + activated carbon + sludge dewatering | 160,000–380,000 |
| 1,200–2,000 kg/hr | 120–200 m³/day | Full ETP with MBR + reclaimed-water system + online monitoring | 380,000–700,000 |
Source: STING Industry equipment sizing guide for soap factory wastewater (2026). CAPEX is indicative and varies with site conditions and local content.
Three cost levers move the most. Equalisation tank sizing is the first: accurate peak-to-average modelling, typically 2.5–3.5 for batch soap lines, keeps every downstream unit smaller. Coagulant selection is the second — switching from alum to polyaluminium chloride commonly cuts coagulant dose by 30–40% and reduces sludge volume. Aeration efficiency is the third: fine-bubble diffusers use 30–50% less energy than coarse-bubble designs for the same oxygen transfer.
Adding the returns side of the ledger to a mid-size plant, water reuse at roughly 30% recycle can save USD 8,000–18,000 a year, sludge dewatering with a belt press can save a further USD 12,000–25,000 against liquid-sludge haulage, and the avoided exposure is larger still: annual regulatory fine risk of USD 15,000–80,000, discharge fees of USD 12,000–25,000, and the revenue from five days of avoided shutdown running into six figures. For a representative 400 kg/hr line, that combination typically pays back in 18 to 30 months.
When Membranes Do Two Jobs at Once
The most interesting development of 2026 is not cheaper treatment for its own sake — it is the merging of compliance infrastructure with product-quality infrastructure. Membrane separation, applied upstream as well as downstream, does both.
On the production side, ultrafiltration and nanofiltration of soap base removes impurities that cause black spots and turbidity, lifting purity above 99.5% and raising oil conversion by 10–15%. On the effluent side, the same membrane logic recovers water, glycerin and oil that would otherwise be lost. Reported outcomes across operating plants include water savings of 60–90%, salt savings above 80%, COD removal above 90%, and a reduction of water per tonne of soap from roughly 30 tonnes to 4 tonnes in export-oriented facilities. The payback cited for one Southeast Asian export plant was eight months — not because treatment is cheap, but because the recovered materials and the retained market access outweigh the capital.
The Demand Is Coming From New Plants, Not Old Ones
The clearest signal that water has become a first-order design question is that it now appears in the specifications of brand-new soap capacity. Africa’s largest single-line continuous soap investment, announced by Rafa Corporation in Nigeria, is built around a 10-tonne-per-hour continuous saponification plant paired with two 4-tonne-per-hour finishing lines — and a closed-loop system that recycles 95% of process water alongside a 5 MW solar hybrid array, cutting its carbon footprint by around 40% against a conventional soap factory.
That combination — closed-loop water, on-site renewable power, and export-grade compliance documentation — is becoming the default brief for new greenfield soap capacity in Africa and Southeast Asia rather than an optional upgrade. For equipment suppliers, it means the water train is no longer sold as an add-on after the production line is specified; it is scoped into the original project, sized alongside the saponification plant, and financed as part of the same package.
What to Watch Next
- Reuse targets becoming permits. As the EU’s revised wastewater directive moves from targets to enforceable obligations, membrane retrofits in existing soap and detergent plants will follow the same path they already took in textiles and pharmaceuticals.
- Packaged and containerised MBR. Skid-mounted units handling 10–100 m³/day, with lead times of 8–12 weeks from the Chinese OEM tier, are making reuse affordable for mid-size plants that could never justify a traditional EPC contract.
- Water as a cost line in the TDK. Expect more buyers to ask for per-cubic-metre operating cost and recovery-rate guarantees alongside throughput specifications — the same way energy intensity was demanded five years ago.
- Membrane life-cycle economics. With membrane replacement cycles settling at 5–8 years, service and replacement contracts are becoming a distinct commercial layer, and buyers are starting to price total lifecycle cost rather than equipment CAPEX alone.
Water was the last uncosted input in soap manufacturing. In 2026 it is being priced — by regulators through tighter limits, by utilities through rising tariffs, and by buyers through compliance requirements written into purchase contracts. The plants that treat it as a design parameter rather than an afterthought are the ones positioning themselves for the next decade of capacity growth.
Sources
- GEP Research — 2026–2030 global and China industrial wastewater treatment equipment market report (2026)
- Zhongsheng Environmental — MBR market growth and key players buyer’s guide (2026); ZLD sizing guide for soapstock water (2026)
- Verified Market Research — global membrane bioreactor market update (2026)
- IMARC Group — soap and detergent industry outlook (2026)
- WHO Effluent Quality Guidelines; EU Water Framework Directive 2000/60/EC; EU Urban Wastewater Treatment Directive 91/271/EEC (2024 revision)
- BlueWave Bio — membrane separation for soap production: quality, cost and environmental outcomes (2026)
- Rafa Corporation / Starium Detergents — Nigeria continuous soap plant announcement (2026)